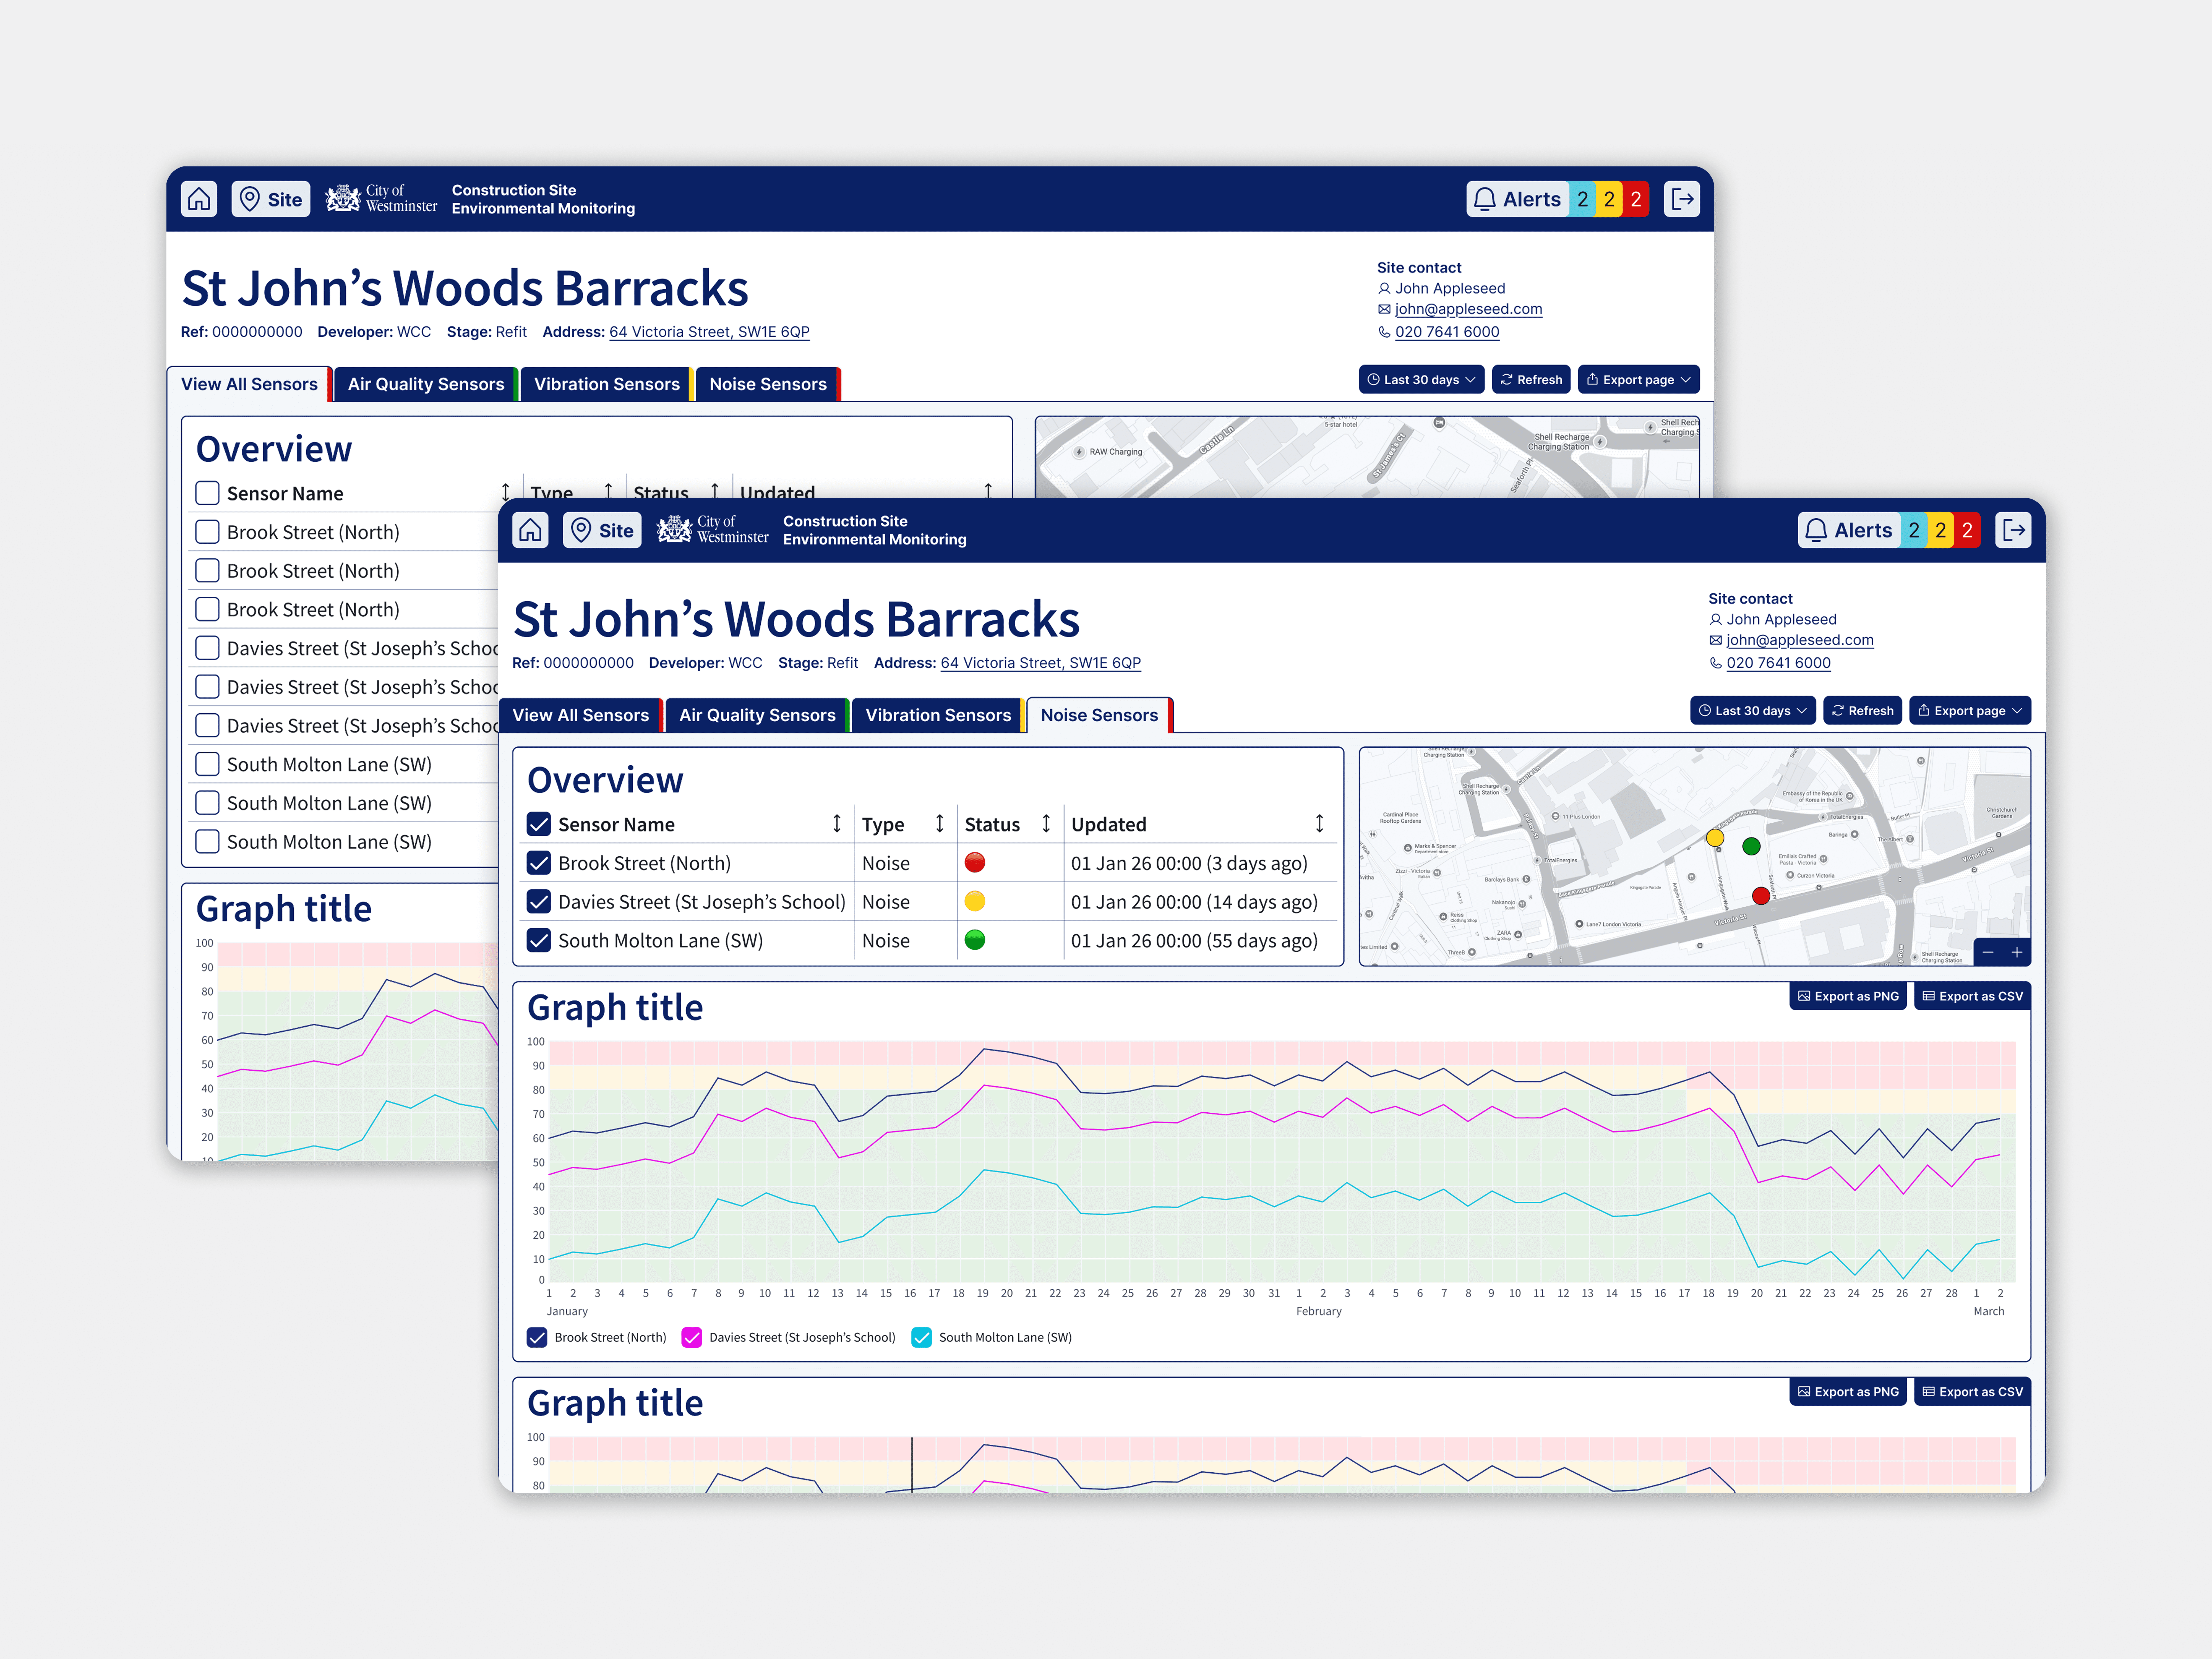
Creating a data visualisation platform for large data sets
The Council's environmental officers needed a new platform to visualise their data
00

problem
Existing market tools did not meet their unique needs and use case
solution
A new in-house dashboard built to their needs, with new features speeding up workflows and improving data validation
Environmental Officers track data from well over 100+ air quality, noise & vibration sensors from constructions sites across the city.
Designed in collaboration with the officers, in brand colours and based on their usability. Some elements feature similar interactions as existing tools, requiring minimal re-training of teams, while modernising their platform.
year
2026
status
In development
my focus
UX Design / UX Research / Content Design
01

02